Guide to Sales Metrics: 14 Examples

Table of Contents:
Sales metrics are the most important tool that allows you to take control of your sales results. You can’t improve what you don’t measure – and a good system of metrics will suggest what to do to increase sales.
What metrics can you track and how to use them in practice? We answer in this guide.
Key takeaways:
- Sales metrics translate numbers into useful information – both for the sales manager and sales reps.
- Choose a maximum of 3 KPIs in sales – they set priorities in the sales department.
- CRM systems make it easy to track key sales metrics.
In this article you’ll read about:
- What are sales metrics?
- Why should you observe sales metrics?
- Sales metrics – examples
- How to implement sales metrics?
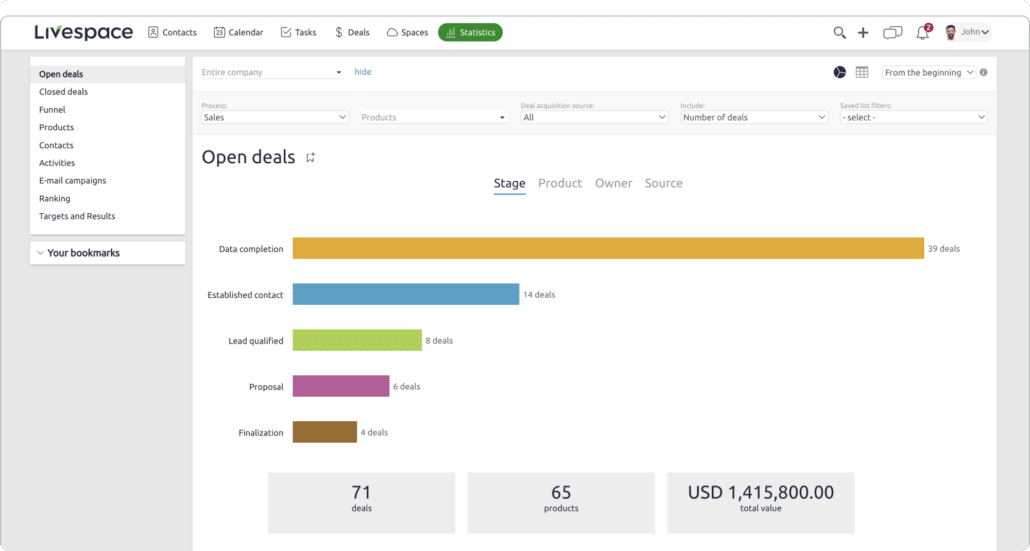
Track the most important sales metrics directly in the CRM system. Understand what impacts team effectiveness. Livespace offers in-depth analytics, supported by AI solutions – and you get the most important numbers at your fingertips.
What are sales metrics?
Sales metrics are measurable values used to track and evaluate the state of the sales process. They are broader than single measures and often consist of multiple elements. This allows you to evaluate the entire sales process.
They can relate to different areas:
- Sales effectiveness metrics: win rate, average time to close, effectiveness at different process stages, conversion rates
- Sales performance metrics: sales productivity metrics (emails sent, calls made), year-over-year growth
- Financial metrics: average transaction value, pipeline value, or customer acquisition cost
- Activity metrics: number of new contacts, response time, or number of sales activities
How do sales metrics differ from KPIs and measures?
Measures are specific numbers, raw data that don’t say much about effectiveness on their own. Examples: number of won sales deals, total number of customers, or total sales value in a given month.
Sales metrics translate this raw data into useful information. They show trends, relationships between different aspects of sales, and help in making fact-based business decisions. A great example here is the win rate, which compares the number of won and closed sales deals – and informs you about the effectiveness of activities.
Key Performance Indicators (KPIs) in sales are consciously chosen metrics that best show progress in achieving strategic company goals. These should be the basis for evaluating team performance and planning actions. Often the win rate or average time to close a sales deal is chosen.
When your sales reps understand what’s behind each metric, they better understand how their work is evaluated – and what the business priorities are.
Why should you track sales metrics?
Short answer: sales data help answer sales managers’ challenges and work on the sales performance. Let’s get into more details.
Priorities setting
Sales metrics that you define as KPIs establish priorities in the sales team. For this reason, there can’t be too many of them – it’s usually suggested to limit to 3 key performance indicators.
Such a limit allows the team to act effectively and focus on those sales deals and activities that bring the team closer to its goal.
Data-driven decision making
Make decisions based on facts, not intuition. Check which lead sources are actually effective, what does your sales pipeline look like, at which stage of the process you lose customers, and which of your sales reps brings the best results.
This allows you to continuously improve your sales team and better understand the target audience. You’ll also evaluate the effectiveness of undertaken actions.
This also enables creating realistic sales targets based on facts and specific numbers.
Process optimization
Metrics are a key element in optimizing sales processes. Thanks to this:
- you’ll find bottlenecks in the process: points where you lose the most customers or waste the most time
- you’ll evaluate the effectiveness of implemented changes
- and you’ll understand how each action translates into final sales results.
You can read more about sales process optimization in the Sales Process Guide.
Sales predictability and control over results
Sales metrics in CRM allow you to quickly assess the current situation in your funnel. This gives you more control and allows you to act faster if achieving sales goals is at risk.
Sales metrics allow you to realistically forecast sales value for upcoming months and quarters. They provide quick insight into the current situation in the funnel without the need to delve into detailed reports.
Moreover, accurate data is a necessary foundation for effective sales forecasting.
Sales metrics: 14 examples
The number and variety of metrics can be overwhelming – especially if you want to choose new KPIs.
Let’s describe the most important sales KPIs and their applications.
Win rate
The win rate shows the ratio of won transactions to closed transactions. It measures the effectiveness of converting transactions into customers.
Here’s a key detail: we only count qualified sales deals, not leads. Why? Lead qualification should be a separate process so you can precisely measure:
- How many qualified leads you receive after the qualification process,
- What is the win rate in the sales process.
Combining these two processes makes it harder to implement improvements because you get less detailed insight into the data.
In Livespace, you can analyze effectiveness by teams and individuals. If you have more than one sales process, you can check the value of this metric for each process separately.
Additionally, you can measure sales process effectiveness by filtering sales deals in three ways:
- By date added
- By date added (counting only closed deals)
- By closing date
Time to win
Average time to win refers to the time a potential customer needs to go through all funnel stages before you win that sales deal. This indicates whether the entire sales process and sales representatives’ activities are effective.
It can be calculated by dividing the total number of days to win by the number of closed transactions to get an overall picture of sales activities’ effectiveness.
Time to close
Time to close is the average number of days needed for a customer to make a final decision (won/lost), counting closed transactions. It only takes into account completed transactions, giving you an accurate picture of the actual speed of closing processes.
Sales cycle
Average sales cycle length typically refers to the total average time a potential customer needs to go through the entire sales process – from first contact to transaction completion – regardless of whether transactions are still open or closed. This is a broader indicator that helps understand the overall sales timeline, including active transactions.
Average Customer Lifetime Value (CLV)
Customer Lifetime Value is the total amount a customer spends from the beginning to the end of cooperation. The goal is to check if marketing and sales budgets are spent wisely. For a company to grow, CLV should be higher than CAC.
Determining this value can be difficult because it requires a complete understanding of budget allocation in the company. Nevertheless, it’s definitely one of the most valuable metrics worth looking at.
Sales pipeline value
Represents the value of all transactions in the sales funnel at a given moment. It monitors expected revenue from sales deals in a specific time period.
Why track this sales metric? It’s easy to check if activities translate into achieving sales goals. Moreover, both managers and salespeople can use this metric to measure their results and progress.
Average deal size
Average deal size is the typical monetary value of won transactions. It helps understand the scale of typical sales and set realistic revenue goals. You can think of it as a “standard” transaction that helps quickly notice unusually small or large sales deals.
Effectiveness at each stage of the sales process
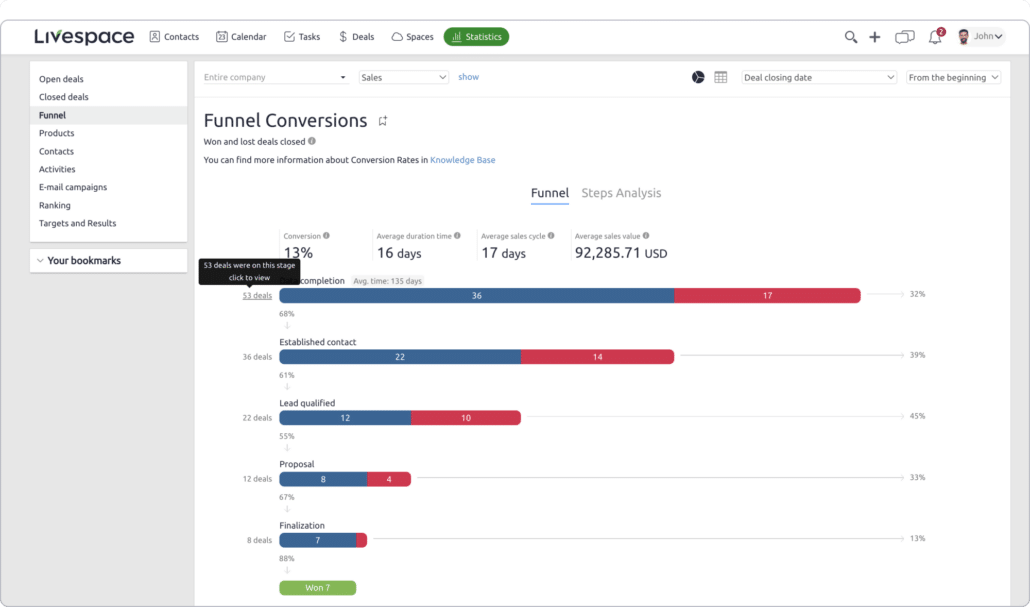
The effectiveness indicator applies to the entire sales process, but its analysis can also be transferred to individual process stages. Conversion at each stage shows how effectively your salespeople guide potential customers through subsequent stages.
This is where you can discover bottlenecks in your processes and start corrective actions.
Focusing on individual stages of the sales process allows you to increase salespeople’s effectiveness. This way you know how many customers you lose at each stage, which should be a warning signal and an impulse to look for improvements.
In Livespace, conversion is measured and visualized at each stage of the sales process. From this level, you can go to the list of sales deals lost at each stage to examine more closely what went wrong.
It’s also worth looking at this data broken down by team members. It might turn out that someone from your team performs better at one stage but needs support at another. This way you can transfer working practices to the entire team.
Lead response time
This is the time between the first inquiry and the salesperson’s response. The shorter, the better — because customers usually choose those who respond first.
Customer Acquisition Cost (CAC)
As the name suggests, this is the total average cost of acquiring a new customer, which essentially includes all sales and marketing expenses (salaries, discounts, campaign costs, etc.).
Why is this important? Because calculating and comparing CAC across different channels can help determine which sources work best in attracting new customers.
Revenue
This is a sales metric that needs no introduction. Basically, it shows how much money was received in a given time period. Although the concept is quite simple, it can be difficult to get a clear picture of the revenue stream.
Many companies decide to calculate monthly recurring revenue (MRR) — that is, the predictable amount of revenue expected each month, or the annual contract value. However, this depends on the company’s specifics, so a deeper analysis of how to measure revenue may be necessary.
Average profit margin
This is probably the most important sales metric for company growth. It simply describes the average profit achieved from all products, services, and sales channels. By tracking this metric, you can identify which offers are best for the company. Additionally, you can use it to check profits generated by individual salespeople or by specific locations and customer demographics.
Pipeline coverage
Pipeline coverage is a metric used to assess how well current sales activities cover potential future sales revenue. It indicates what chances the sales team has of achieving set sales goals.
Measuring pipeline coverage involves comparing the value of the current sales funnel with expected sales revenue. Ideally, the sales potential should be greater than the sales target.
Example:
- Sales funnel value in May is 400,000
- The sales target for the same period is 1,000,000
- Therefore, the pipeline coverage ratio is 0.4
Measuring pipeline coverage is meant to help sales teams assess whether they have enough sales deals in the funnel to achieve their goals. If the coverage ratio is low, it’s a signal that the team might have trouble achieving expected sales revenue.
In such a situation, you can react early — both at the sales level and in marketing generating additional sales deals.
This can also support forecasting future sales revenue. Based on current data, you can estimate what revenue you can expect in a given period. This is very important for company financial and strategic planning.
How to use sales metrics in practice?
Sales metrics themselves must be properly implemented to utilize their potential. After all, raw numbers without context won’t tell you much. So how should you approach measuring your sales activities?
Define business and sales goals
First, define the business and sales goals you want to achieve. It’s important that these goals are realistic, measurable, and time-bound. For example, you might decide that you want to focus on acquiring larger customers and increase the average sales value by 20% over the next 6 months.
Select appropriate sales metrics
Next, select appropriate sales metrics that will allow you to measure progress toward your goals. It’s important to choose metrics that are most closely related to your business goals. In the given example, this will certainly be the average sales value. Process effectiveness or effectiveness at a specific stage of the sales funnel, such as proposal creation, might also be useful.
Choose a monitoring system
Choose a monitoring and reporting system that will allow you to track selected sales metrics. You can use Livespace for this purpose. It’s important that the monitoring system is simple and transparent, making it intuitive and easily accessible for all salespeople.
Regularly measure sales results
Regularly measure results in the context of business and sales goals. Look for areas to improve the process. Try to identify trends in the data. This will help you better adjust sales strategies and tactics, and even the entire sales process.
Optimize
Carefully experiment and optimize. Based on monitoring results and analysis, you can start testing and then implement improvements. Make decisions based on facts and hard data analysis, not on intuition or hunches. For example, if you notice that your average sales value is declining, you can undertake upselling or cross-selling activities, or look for sources generating more valuable sales deals.
Use sales tools
A CRM system analyzes data entered by sales reps and shows statistics without the need to create complicated Excel spreadsheets or manual data entry. This simplifies tracking sales metrics like:
- current sales KPIs
- changes over a given period and comparisons
- values for specific processes or activities, e.g., number of new customers acquired from a given source
- projected sales value
Talk to our team and see how Livespace can help monitor progress in your sales department and boost the company’s growth.
Other posts

Closing Deals: 7 Proven Ways to Close B2B Deals Faster (Even in a Tough Market)
Choosing a CRM – 10 common mistakes and how to steer clear of them
