What is a Sales Process Flowchart? Sales Process Flowchart explained (with Examples)

What is a sales process flowchart?
Sales processes can often be complex and sophisticated, with numerous steps and conditions that differ actions for various customer segments. This can often make it challenging for sales reps to ideally reflect the company’s sales process in their work. That’s where sales process flowcharts can help by visualizing the steps. They can simplify the process, turning a complicated workflow into something easy to understand and follow.
Why is it worth creating a sales process flowchart?
A clear sales flowchart keeps everyone on the same page, making it easier for your team to follow best practices and stay consistent. It removes guesswork, helps spot areas for improvement, and streamlines the entire process. With a well-structured flowchart, your sales reps can work more efficiently, close deals faster, and create a better experience for customers.
How to make a sales process flowchart?
To begin, it’s best to have a tool like Miro so your entire team can work collaboratively, but even a simple piece of paper would do.
Quick note: To create a flowchart, you need to have a sales process. If you don’t have one yet, here’s a quick guide on how to create it.
1. Identify the sales process
Start by clearly defining your sales process. This typically includes all the stages a potential customer goes through before they become a paying client, from lead generation to closing the sale.
Remember that your sales process is the backbone of your revenue strategy. You can build it from scratch to fit your business model or base it on a proven methodology like BANT, Challenger Sales, or Solution Selling.
2. List all stages in the sales process
Write down each step of the sales journey. This could be a mix of activities and decision points. A detailed list will help you visualize the flow of actions.
Example: For a SaaS company, the steps might look like:
- Sales outreach (calling or emailing qualified leads).
- Qualification (is this lead ready to buy?).
- Demo/meeting (presenting the product).
- Proposal (sending contract or formal offer).
- Negotiation of terms.
- Closing (sealing the deal, collecting payment).
For other sectors – like in the case of online store ROKR – this can be different. Alfred Christ, the company’s Sales Manager, told us that they compartmentalize their sales cycle into the following stages: Initial Contact, Product Demonstration, Negotiation, and Finalization. “They each contain clear actions such as sending product samples or discussing pricing options at each step,” he explained.
“One recommendation I have is to keep the flowchart simple – just the most salient touchpoints. For example, when a lead reaches the stage of “Product Demonstration” at our company, we take note of the types of demos (3D puzzle kits or wooden toys) to be presented, along with the emphasis on the main selling points. This visualizes clarity for the sales team to know what to prioritize at every step, thus ensuring smoother execution and greater alignment,” he said.
3. Choose the right flowchart symbols
To make your flowchart easy to understand, use the right symbols. Each symbol represents a different part of the process:
- Oval: Start or end point (e.g., start of the process, deal closed).
- Rectangle: An action or task (e.g., send email, call lead).
- Diamond: Decision point (e.g., is the lead qualified?).
- Arrow: Shows the direction of the flow between tasks.
Here’s an example of how these different elements look like in Miro:
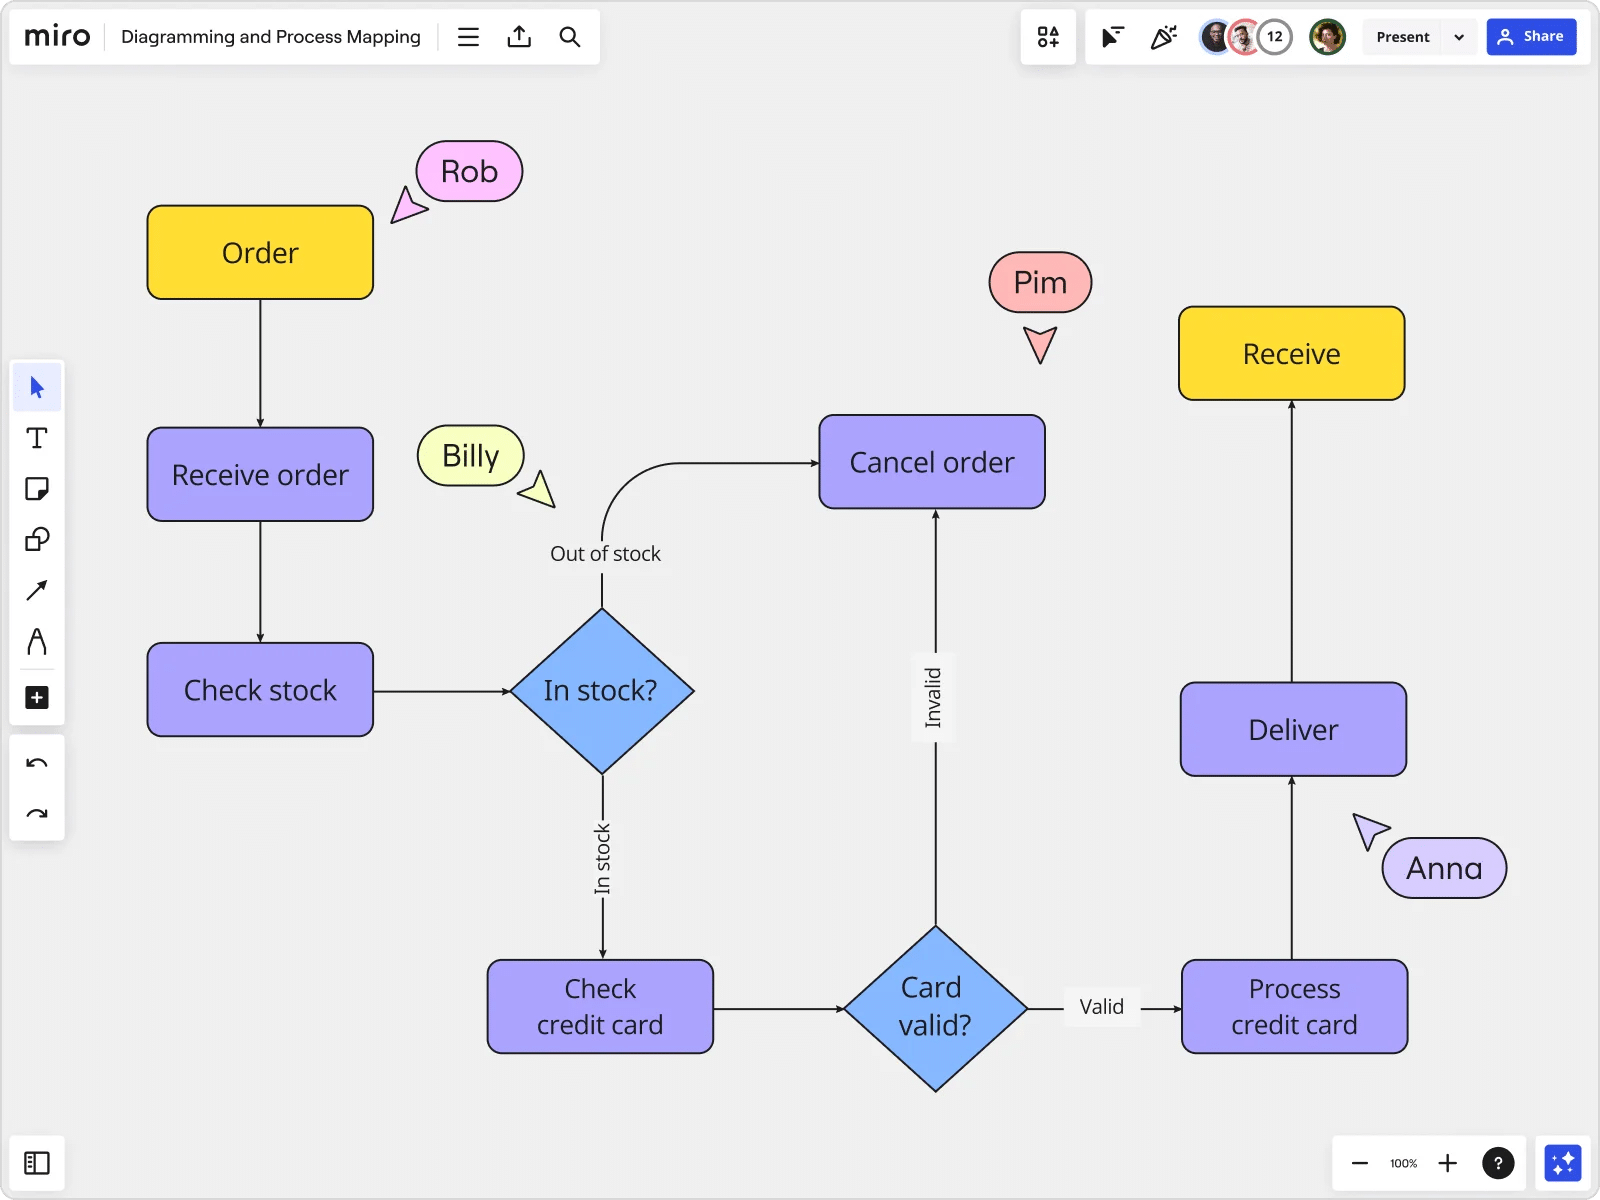
Example: For the sales process, an Oval could represent the “Lead Generation” stage, and a Rectangle might represent the “Send Proposal” step. A Diamond could be used to signify a decision point, like “Is the client ready to buy?”
4. Map out the process steps
Now that you know the steps and symbols, start placing the steps in logical order. Use arrows to show how each step leads to the next.
Example Sales Flowchart:
- Oval: Start – Lead enters the pipeline.
- Rectangle: Sales rep reaches out to lead.
- Diamond: Is the lead qualified?
- Yes: Proceed to Rectangle – Schedule a demo.
- No: Proceed to Oval – End (discard the lead).
- Rectangle: Conduct a demo.
- Diamond: Is the lead interested in purchasing?
- Yes: Proceed to Rectangle – Send Proposal.
- No: Proceed to Oval – End (exit the process).
- Rectangle: Send proposal/quote to lead.
- Diamond: Is the price acceptable?
- Yes: Proceed to Rectangle – Close the deal.
- No: Negotiate or adjust proposal.
- Oval: End – Deal closed.
5. Add decision points and branches
Sales processes often include decision points where you need to evaluate if a lead is a good fit, if they’re ready to buy, or if they accept the price. These are typically represented by Diamonds.
Tip: Limit decision points to those that significantly impact the next step. Too many decision points can clutter the flowchart and make it harder to follow.
Example:
- A decision point like “Is the client ready to buy?” should have a Yes/No branch. If “Yes,” it moves to “Send Proposal,” if “No,” it might go back to “Follow Up Later” or “Move to Nurture Campaign.”
6. Review and edit the flowchart
Review your flowchart for clarity. Make sure the process is easy to follow, and all decision points are logical. Keep the flowchart simple but comprehensive, avoiding unnecessary details that could confuse the viewer.
Tip: Show the flowchart to someone who doesn’t know the sales process well. If they can easily follow it, you’ve made it clear enough. If they struggle, simplify it or break it into smaller steps.
7. Finalize and use the flowchart
Once you’ve reviewed the flowchart and are satisfied with its clarity, finalize it. You can use colors, labels, or icons to emphasize key points, but be sure not to overcrowd the diagram. Keep it neat and readable.
Example: Use different colors to highlight key stages, such as lead qualification (green), proposal stages (blue), and closing stages (red).
Here are a few extra tips for creating B2B sales process flowcharts
- Use consistent symbols – stick to one set of flowchart symbols throughout. This maintains clarity and helps everyone understand the process.
- Color coding – use colors to differentiate between stages, such as lead qualification in green, demo/meeting stages in blue, and closing in red. However, don’t overdo it; keep it simple.
- Incorporate metrics – you can also add key performance indicators (KPIs) at each stage, like “Conversion Rate at Proposal Stage” or “Time to Close.” This adds actionable data to your flowchart.
- Digital tools – use flowcharting tools for a professional look. These tools allow you to easily adjust the flowchart, and some even offer templates specifically for sales processes.
Expert tips on creating a CRM sales process flowchart
We have spoken to a few sales experts, and here are the tips they shared on creating sales process flowcharts:
Keep it simple
A huge mistake people often make when creating a sales process flowchart is trying to include too much information at once. “A flowchart should be a guide, not a data dump,” said Chris Bajda, Managing Partner at Groomsday.
“I learned this when we first created our own at Groomsday – it was packed with too many decision points and steps. As a result, our sales team didn’t use it effectively. We simplified it by focusing on the four key stages that drive sales: lead generation, nurturing, closing, and post-sale follow-up,” he added.
Once they removed unnecessary details, the flowchart became something the team could easily follow and use daily.
“One thing I always recommend is having clear, actionable steps for each phase in the process. At Groomsday, each stage of the flowchart had one key action to complete before moving on to the next step,” said Bajda.
Create flowcharts that are as dynamic and flexible as your sales process
“In my real estate practice, we break down the process into clear visual stages, from prospecting to closing. But beyond that, we include elements like timing, urgency, and follow-up points that help determine how to respond to potential buyers at different stages,” said Mark Sanchez, Founder of Tropic Residential.
Tropic Residential uses a visual timeline for each property sale. This includes key milestones like initial interest, property tours, and closing. It gives the team a clear view of where the deal stands and allows them to adjust strategies in real-time. “When we worked with an investor on a property flip, this approach helped us adjust pricing and communication based on the sales timeline, resulting in quicker, more profitable closings,” shared Sanchez.
Present actionable insights only
Refrain from including too much information on your flowchart – focus primarily on actionable insights.
“Your visualization should clearly highlight areas where you can take concrete steps to improve performance. Concentrate on key metrics that directly impact revenue and conversion rates. Avoid cluttering your visuals with extraneous information that doesn’t drive decision-making. The goal is to create a streamlined view that allows you to quickly identify bottlenecks, trends, and opportunities in your sales funnel,” said Will Yang, the Head of Growth and Marketing at Instrumentl.
He told us that when he led the sales team at his previous tech startup, they implemented a simple funnel visualization that tracked conversion rates between each stage of the sales process. By focusing on just five key stages and their associated conversion percentages, they were able to quickly spot that their demo-to-proposal stage had an unusually low conversion rate.
This insight led them to revamp their demo process, resulting in a 15% increase in overall close rates within two quarters. The clarity and actionability of the visualization were crucial in driving that improvement.
Create multiple flowcharts if your process is really complex
If your sales process is very complex, then you might consider creating a few flowcharts, instead of just one to show the different stages of your sales process. “Don’t try to cram every single detail onto one diagram or flowchart. Instead, break it down into multiple visualizations that each highlight a specific aspect or stage of the process,” is what we heard from Noel Griffith, CMO at SupplyGem.
You can have one visualization for the lead generation and prospecting stages, another for the needs analysis and presentation stages, and a third for negotiation, closing, and follow-up. This makes it much easier to communicate the key steps and decision points without overwhelming people with too much information at once.
Griffith said he learned this lesson the hard way early in his career. He had created this massive, complicated visualization that attempted to capture their entire sales cycle from start to finish. “It looked more like a tangled ball of yarn than a coherent process map. Whenever I tried using it to train new hires, their eyes would glaze over about 5 minutes in. After that experience, I broke it down into more focused visualizations – and understanding improved dramatically,” Griffith said.
The takeaway? Sales is complex enough without convoluted visuals adding to the confusion.
Consider naming the steps after real-life customer conversations
Sometimes, the issue with sales flowchart usability isn’t the steps themselves; it’s about vague nomenclature Callum Gracie, Head of Marketing at Tim The DJ, shared a story from a previous company, where he was involved in the sales flowchart design process. He said that the visualizations became much more practical for the team once steps were shaped after actual conversations with clients rather than just internal procedures.
“We first examined the actual locations of lead dropoffs. We then added decision points into the flowcharts, like “Did the prospect engage?” with explicit next steps in place of simply listing “Follow-up Email” as a step,” Gracie explained. Instead of adhering to a strict framework, this allowed the sales representatives to make adjustments in real-time.”
Include customer fatigue checkpoints
Brand Ignite CEO, Khan Muhammad Imran, shared an original approach to his agency’s sales process flowchart. Namely, on top of the steps that reflect their sales process, they’ve also introduced so-called “decision fatigue checkpoints”. This came after the company realized deals often came to a halt not because of the pitch or the pricing, but because decision-makers hit cognitive overload.
“We added checkpoints after every major stage. Discovery. Proposal. Negotiation. At each one, the rep pauses to ask, ‘Is the client overloaded?’. If the answer is yes, we shift focus to simplifying the decision. For example, offering a one-pager instead of another deck, ” Imran said.
After visualizing these smaller steps in the flowchart, sales reps stay grounded in that their job isn’t to “just” sell. It is to reduce decision fatigue, too. Imran shared with us that, after ensuring all sales people applied checkpoints, the deal velocity increased by 18 percent in six months.
The usefulness of your sales flowchart depends on the effectiveness of your sales process
The more complex your sales process, the more useful sales flowcharts can be to understand how leads become customers – and what steps or obstacles stand in the way.
Ideally, your flowchart should let you understand if there are any bottlenecks and if so, where they most frequently happen.
The most important thing to realize here, however, is that you can’t create a helpful flowchart if it’s based on a suboptimal sales process.
To learn how to create a sales process which ideally reflects your sales methodology and keeps up with your internal changes, attend Livespace’s webinar: How to effectively design a sales process.
Other posts
7 most widely used sales reports (with free downloadable templates)
Sales methodology vs sales process – how they influence each other and how to build them effectively